The clamp was turbo, not frequency
Two rows in my own notes could not both be true.
The first said 2.4 GHz with turbo off, 45 seconds of load: 95 °C, then it clamps. The second said 1.4 GHz, 180 seconds: plateaus at 92 °C, stable. I acted on the second one back in September and capped this machine at 1.4 GHz, which is a strange number to arrive at and a very easy one to leave alone.
But a core held at 1.4 GHz cannot settle hotter than the same core held at 2.4 GHz under the same load. Less clock means less power means less heat. The rows were sorted hottest-last because every run started on a heatsink still soaked by the one before it. The table was measuring my run order, and the last row inherited the worst of it. So the cap was fitted to a property of the measurement, not of the CPU.
What the machine is: a Lenovo Y50-70 from 2013, i7-4700HQ, four cores and eight threads, 2.4 GHz base and 3.4 GHz turbo. It runs Debian and two self-hosted GitHub Actions runners that execute my CI (lint, unit tiers, integration, docs, deploys), all of it under one CPU cap.
The gate that was missing
The old table had two defects, and only one of them was about temperature.
Every run now waits for the package to fall to 56 °C before it starts (COOL_TO=56, 300-second timeout, and a run that times out says so instead of quietly starting warm). That one line is the difference between measuring caps and measuring history.
Frequency comes from turbostat’s Bzy_MHz, not scaling_cur_freq. Under intel_pstate in passive mode the latter reports a target: mine sits near 1297 MHz whether the cores are idle or pinned to the floor, so the old table’s instrument could not see the thing it was investigating.
Throttling comes from the MSR-backed counters, summed across all eight CPUs before and after the load as a per-run delta. A run cannot inherit another run’s events.
The heavy load is stress-ng --cpu 8 --cpu-method fft. Sysbench’s default peaks around 22 W on this chip and never reaches the wall, which is how a 1.4 GHz cap can look adequate.
Turbo reaches the wall in about a second
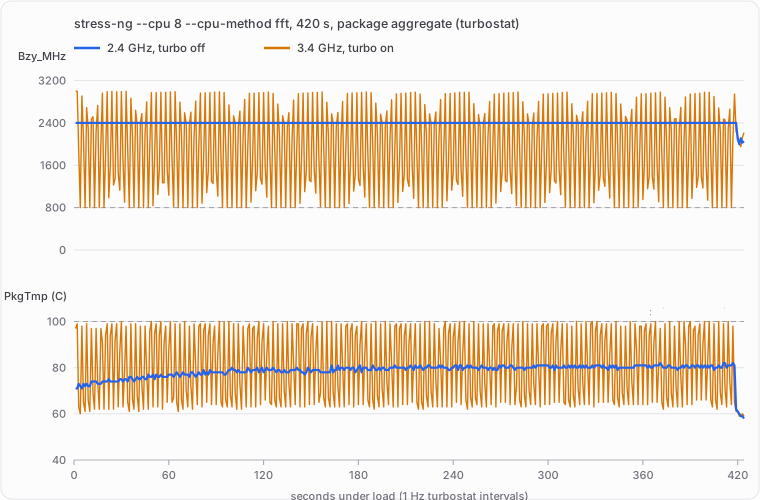
Both lines are 420 seconds of all-core load, measured the same way. The blue one is 2.4 GHz with turbo off. The orange one is 3.4 GHz with turbo on.
The orange line is not a frequency. It is an oscillation between the 800 MHz floor and roughly 3000 MHz, and it never stops. Its first one-second interval already reads 3000 MHz and 97 °C; by the fourth second the package is at the floor. Over the run, 83 of 424 intervals sit at 800 MHz and the counters accumulate 283,300 throttle events. Peak package power is 51.54 W against an average of 31.58 W, because the package is spending most of its time fast enough to trip, hot enough to clamp, and slow enough to recover.
The blue line holds 2396 MHz for the whole 420 seconds, settles at 82 °C, spends zero intervals at the floor, and logs zero throttle events, drawing 31.55 W on average and 32.34 W at peak.
That is what the 800 MHz clamp is: turbo’s excursion hitting the junction limit, not a frequency the chassis dislikes. Chasing it downward was always going to work. Anything that keeps the package off the wall works, and that approach also threw away the headroom it was supposedly protecting.
2.72 GHz holds, which is not the same as fitting
At 2.72 GHz the package holds 2700 MHz flat for 420 seconds: zero intervals at the floor, zero throttle events. It does not clamp. It draws 41.29 W and sits at 98 °C, with 206 samples at or above 95 °C.
So it survives my worst case. It also leaves two degrees of margin on a laptop whose fan is behind a dusty 2013 intake, with a second runner able to start a job at any moment. A cap is not a measurement of what one job can survive; it is the ceiling every job has to live under. I took the 2.4 GHz number, which leaves 18 degrees below the limit, and left 2.72 GHz as a documented “holds, but no”. What it would do with a second job starting at second 300 is the part I cannot schedule on purpose.
What the real workload does
The synthetic worst case is not the argument. What matters is the real unit tier, pnpm test, which is turbo run test --concurrency=1, the same command the CI core job runs:
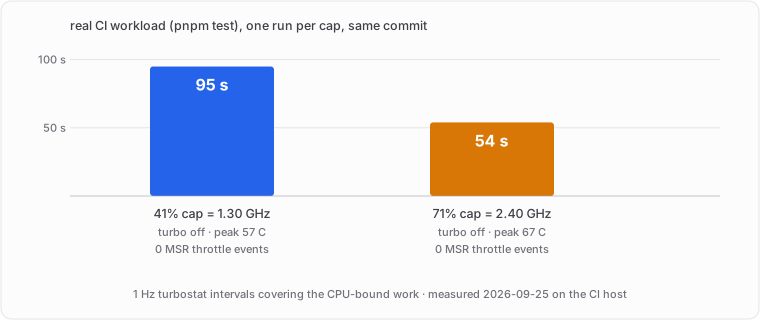
At the 41% cap the unit tier ran 95 seconds at a measured 1300 MHz, drawing 15.66 W and peaking at 57 °C. At the 71% cap it ran 54 seconds at 2399 MHz, drawing 23.99 W and peaking at 67 °C. Both runs: zero throttle events, zero intervals at the floor.
95 seconds to 54 is 1.76×, and it costs 10 degrees on a workload nowhere near the limit (24 W of a 32 W worst case). The honest reading is not that raising the cap bought headroom: 33 degrees of it were already sitting there unused while a 1.4 GHz cap slowed every job down.
One thing that did not buy speed, though I thought it had: a commit that cut 268 seconds from a 468-second e2e job by restoring a 984 MiB Playwright browser cache over the network at 3.9 MiB/s. The job got shorter; the CPU-bound phases and the thermal wall did not move.
And when a real CI job later ran through the runner at the 2.4 GHz cap, the sampler caught it at 119 seconds, peak 69 °C, mean 20.4 W, zero intervals at the floor, zero throttle events.
One caveat on all of those numbers: I ran the unit tier directly as my own user, not through the runner service, so the runner’s CPUQuota is not in them. It moved from 600% to 800% on the 1st of October, after these runs, and a real job under the new quota has not been sampled yet.
Two fixes that don’t work on this machine
I would rather document the failures than leave them implied, because both look reasonable from the outside.
A kernel passive thermal trip is the textbook answer: let the kernel throttle before the hardware does. On this box, thermal_zone1 has no cooling devices bound to it, trip_point_*_type is read-only, and the registered passive trip is disabled at −274000. I set one at 60 °C anyway and watched the package run flat at 2400 MHz through it to 80 °C, without a single cooling device leaving state 0. The interface exists; it does nothing here.
A userspace guard that lowers the cap as temperature rises is the other obvious answer, and I built one: a 1 Hz poll through an exponential moving average. Turbo reaches the junction limit in about a second. In the test it logged eleven samples at or above 95 °C, hit the floor six times, kept 7,570 throttle events, and settled at 88-90 °C and 2477 MHz. That is hotter and slower than leaving the cap alone. It wants about thirty seconds to converge on a problem that resolves in one. I kept it, because a negative result you can point at beats a deleted file.
What actually changed
sudo sed -i 's/^CPU_MAX_PERF_ON_AC=.*/CPU_MAX_PERF_ON_AC=71/' /etc/tlp.conf
sudo tlp start
41% to 71%, turbo still off, and the rollback is the same command with 41 in it. Identity-wise nothing else moved: the governor is still schedutil, and the driver still intel_cpufreq in passive mode.
The rows are in results.csv, including one aborted attempt that produced no turbostat intervals and survives as a row of zeros. A table that keeps only the runs that worked is how the previous one ended up misleading me. The runs were taken four patch releases behind the kernel the host runs now, on the same 6.12 series; the policy knobs are byte-identical across that boundary, so the comparison holds, but the numbers belong to the older build.
The temptation with a speedup number is to assert it. I would rather it be checkable, so here is the way in. public/thermal holds the rows, the fingerprint with its config-hash, and both 420-second turbostat logs, still gzipped. thermal-charts.mjs is the script that draws the two charts above from those files, and thermal-fingerprint.sh prints your own machine’s state and hash, so two runs can be compared honestly.
Point the script at your logs and you have your own version of the chart. The number I want is where your power curve knee sits, and whether it holds with a second job running. Open an issue with your Bzy_MHz series and your config-hash, or mail it to me. That is the measurement I still cannot make here.